Everyday Life, Visualized Through Data
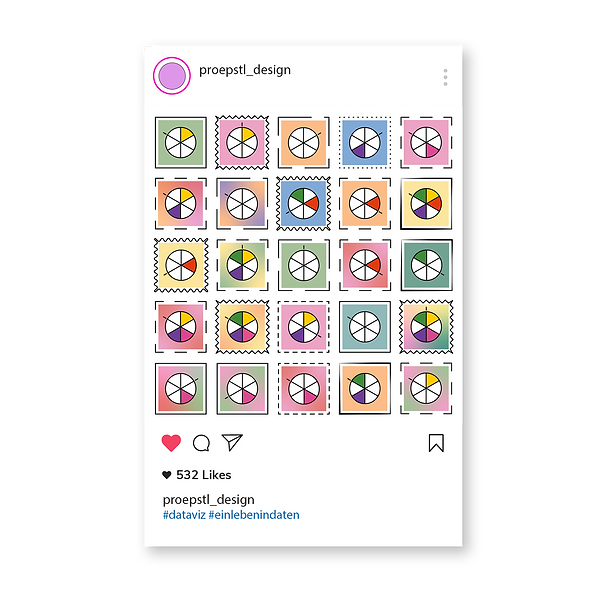
On my Instagram account, I share data visualizations based on the small (and not-so-small) data points of my everyday life.Over time, these posts have become a kind of personal data diary — capturing habits, thoughts, routines, and moments through visual form.
What I love most about this project is the freedom to experiment: with tools, styles, and storytelling approaches. It’s my space to try things out, get playful with data, and explore the intersection of design and daily life — one chart at a time.


A data-driven look at my 2023 reading journey – this graphic captures every book I finished, revealing patterns, preferences, and the occasional binge-read.


This graphic visualizes my tracked habits from January to June 2024. It offers a personal insight into routines, patterns, and fluctuations over time – turning daily behavior into a clear and engaging visual narrative.
For this embroidered data visualization, I analyzed the podcasts I listen to regularly. The result is a tactile representation of my listening habits – translated into thread, color, and pattern to explore how data can be experienced beyond the screen.


This visualization is based on a family survey about the most loved – and most hated – vegetables. The result combines personal data with playful presentation, turning strong opinions into a colorful, veggie-themed chart.
Outcomes from the workshop Self-Tracking & Analog Data Visualization, which I conceptualized and led. Participants explored personal data through hands-on, non-digital methods – translating routines, moods, and habits into creative, tactile visualizations.

A poster visualizing the age of songs in each of my Spotify playlists. The analysis explores how much “old” vs. “new” music I listen to – revealing patterns in nostalgia, discovery, and playlist curation.
For this graphic, I tracked every moment I felt happy over the course of three months. The result is a personal visualization of joy – mapping small, everyday experiences to reveal emotional patterns over time.