Visualize Your Life (with Yarn, Paint & Paper): A Workshop Recap
- klaraproepstl
- 30. Juli
- 3 Min. Lesezeit
Aktualisiert: 4. Aug.
During my master’s, I had the chance to co-organize a workshop that combined some of my favorite things: creativity, data, and a whole lot of analog magic.
Together with fellow student Hyeonji, we ran a week-long project course called "Self-tracking & Analog Data Visualization" – and yes, that title is a bit of a mouthful. But the idea behind it was actually quite simple (and fun):
What happens when we track little bits of our everyday life—and then ditch the screens and visualize that data using only our hands and some crafting materials?
The Idea: Self-Tracking Without Screens
We started with a bunch of questions:
How many dogs do I see on my daily walk?
How often do I smile at strangers?
What kinds of books do I actually read?
How does rain affect my mood?
These seemingly random things actually tell us a lot about ourselves—if we take the time to observe them. And so, our students were asked to pick something personal, collect some data over a few days, and then visualize it using only analog methods: think watercolor, knitting, embroidery, collage, even installation art. No Excel, no Figma, no Tableau. Just human hands and imagination.
Warm-Up Phase: Paint, Track, Repeat
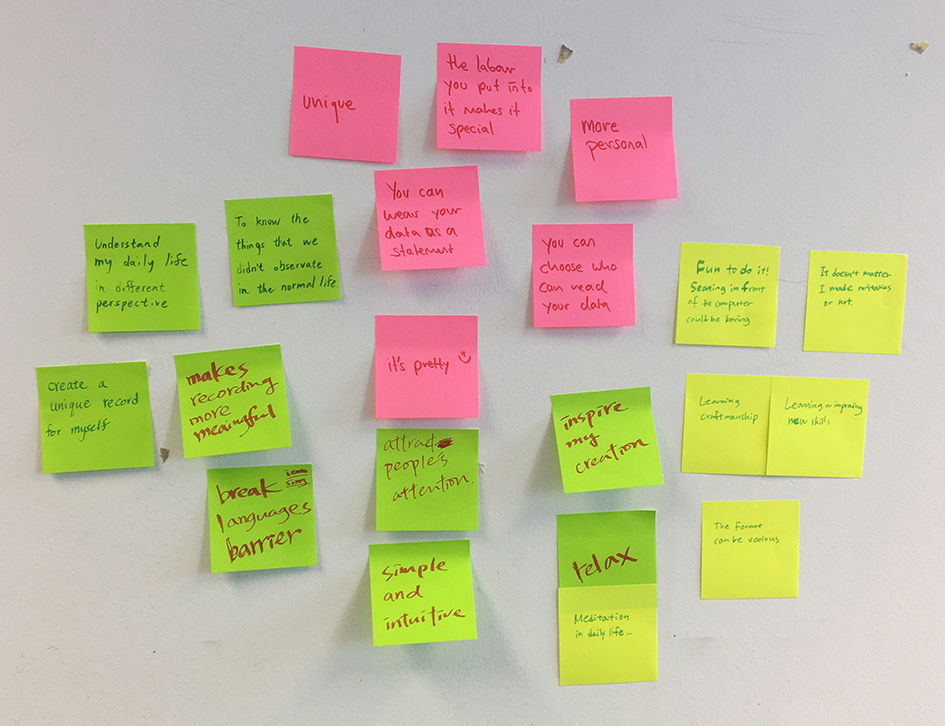
We kicked off the course with some inspiration (shoutout to Dear Data by Giorgia Lupi & Stefanie Posavec!) and got our students thinking about what kind of data they’d like to track and why analog might be the better medium sometimes. The answers were surprisingly deep—and often funny.

Next, we had a series of hands-on warm-up exercises:
Visual Variables 101: Playing with color, texture, and form to represent data.
Campus Tracking: A 30-minute micro-mission to collect data on campus.
Mini Visualizations: Turning that campus data into quick analog pieces—collages, doodles, zines, you name it.
Homework: Commute as Data
For a small homework assignment, each student had to log data from a daily journey of their choice. Some tracked sounds on the way to class. Others mapped emotional responses to certain locations. One student even visualized how many fellow Asians they encountered in Berlin over three days—bringing in thoughtful, personal layers to the data.
Final Projects: Personal, Playful, Poetic
The main project spanned a few days, and the results were seriously amazing:
Mood tracking turned into embroidery on tote bags.
Eating habits were transformed into colorful acrylic paintings.
Someone visualized daily scents (!!) through stitched patterns.
My favorite part? Each piece felt like a little portal into someone’s world. You could sense the care behind each line, stitch, and brushstroke.
And yes, I made something too: a dimensional paper piece about all the small moments that made me happy during the week.
What We Learned (Besides How to Embroider a Graph)
As tutors, we were thrilled. The students jumped into this project with such curiosity and openness—most of them had never done anything like this before. The analog approach pushed them to slow down and really engage with their data in a physical way. And through that, they gained a new way of seeing themselves.
I hope this inspires you to pick up a pen, some yarn, or even a potato stamp—and start tracking your own weird, wonderful data.
Because your life? It’s totally chart-worthy. 📊💫


Kommentare